
For on-call engineers
Keep the tool you already trust
Detection stays with Datadog or Better Stack. One webhook opens the incident here, marks the components, and fires the broadcast. No second console at 3am.
HomeStatus Pages
Get startedComponent-level health on your own domain, HTTP checks running on a sixty-second interval, and an inbound webhook that lets whatever already watches your systems open the incident with the right components marked.
Book a demo →Per component
API, dashboard, webhooks and integrations each carry their own status.
60 seconds
Default monitor interval, dispatched from a scheduled worker pool.
Inbound webhook
Datadog, Pingdom, Better Stack or your own check can open an incident.
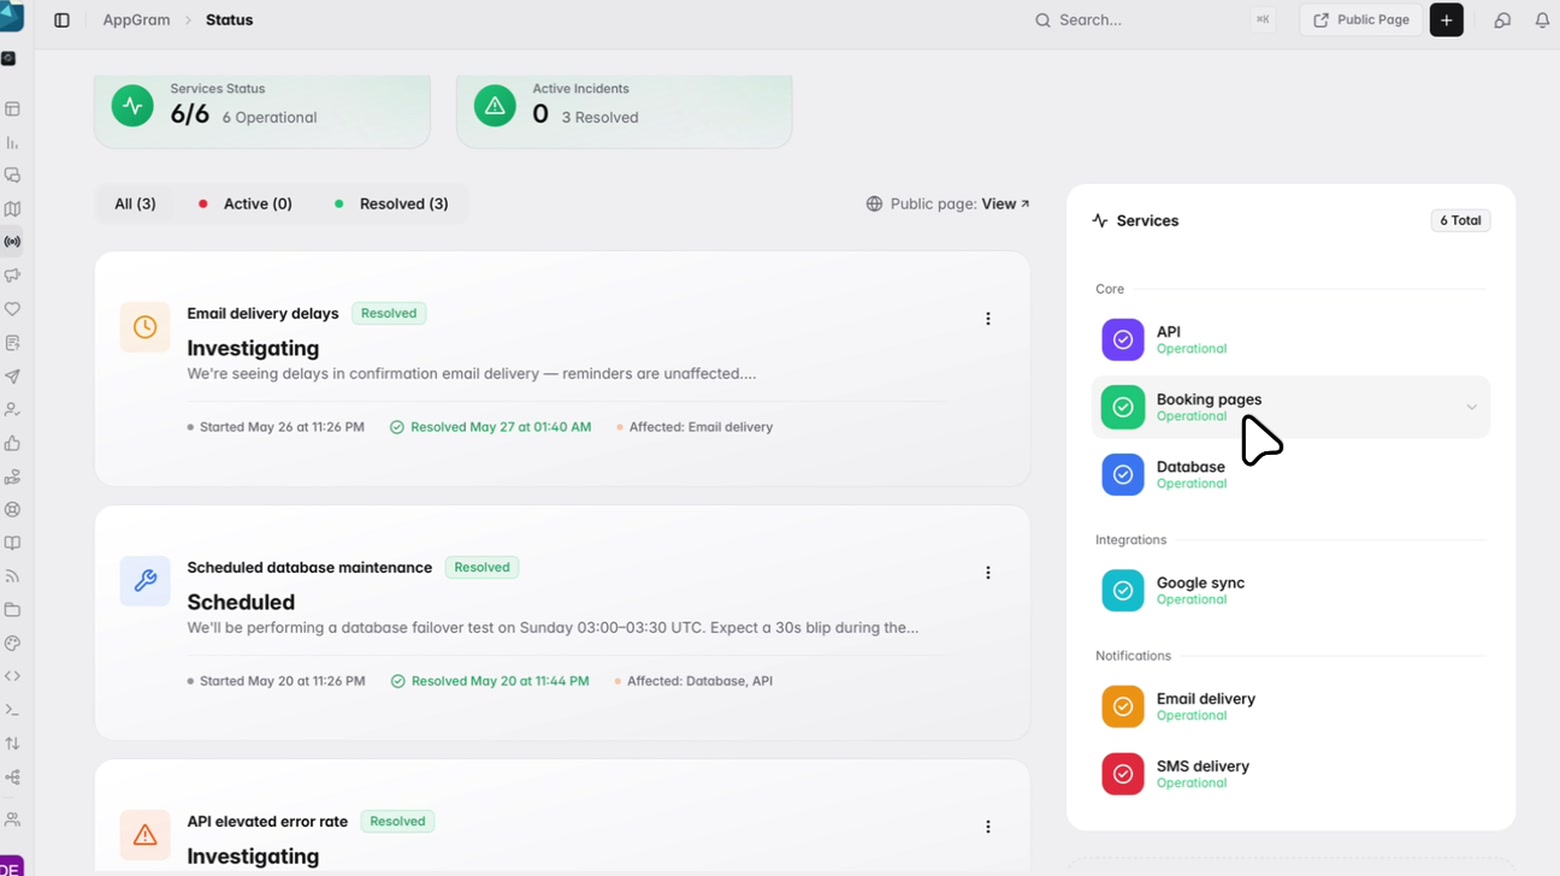
Components
Model your architecture the way your customers experience it — API, dashboard, webhooks, each region, each integration. When webhook delivery is slow but everything else is fine, the page says exactly that instead of forcing an all-or-nothing call.
Incidents
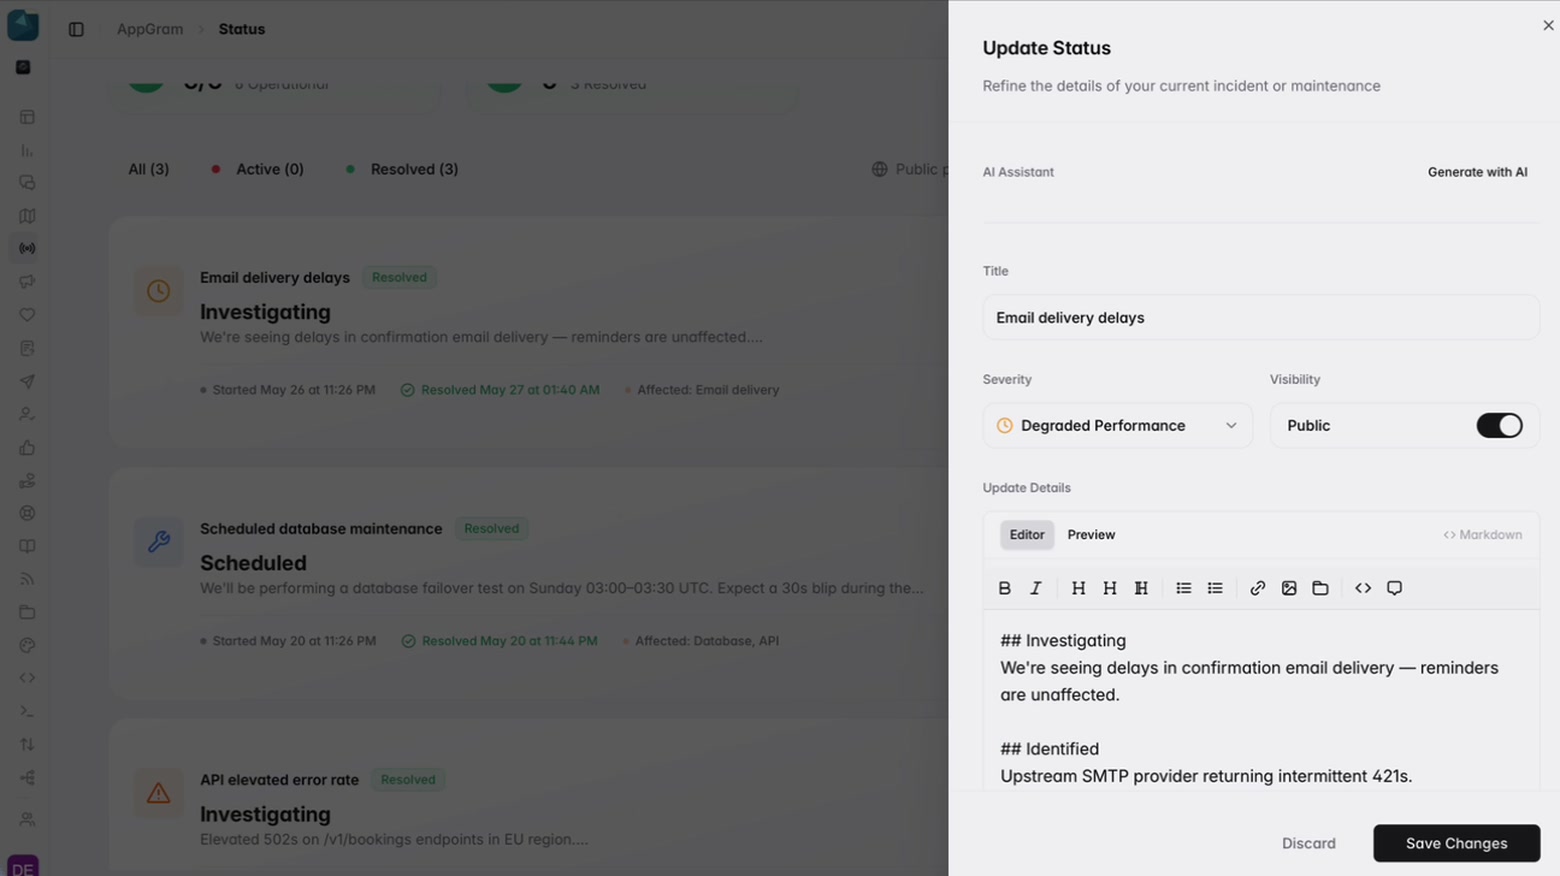
Open an incident, pick the affected components, and write the update in markdown. Opening one fires an automation trigger, so the announcement goes to Slack, Discord, Teams, Telegram, or email through your own provider — wherever your customers actually are rather than a subscriber list they never joined.
Automatic
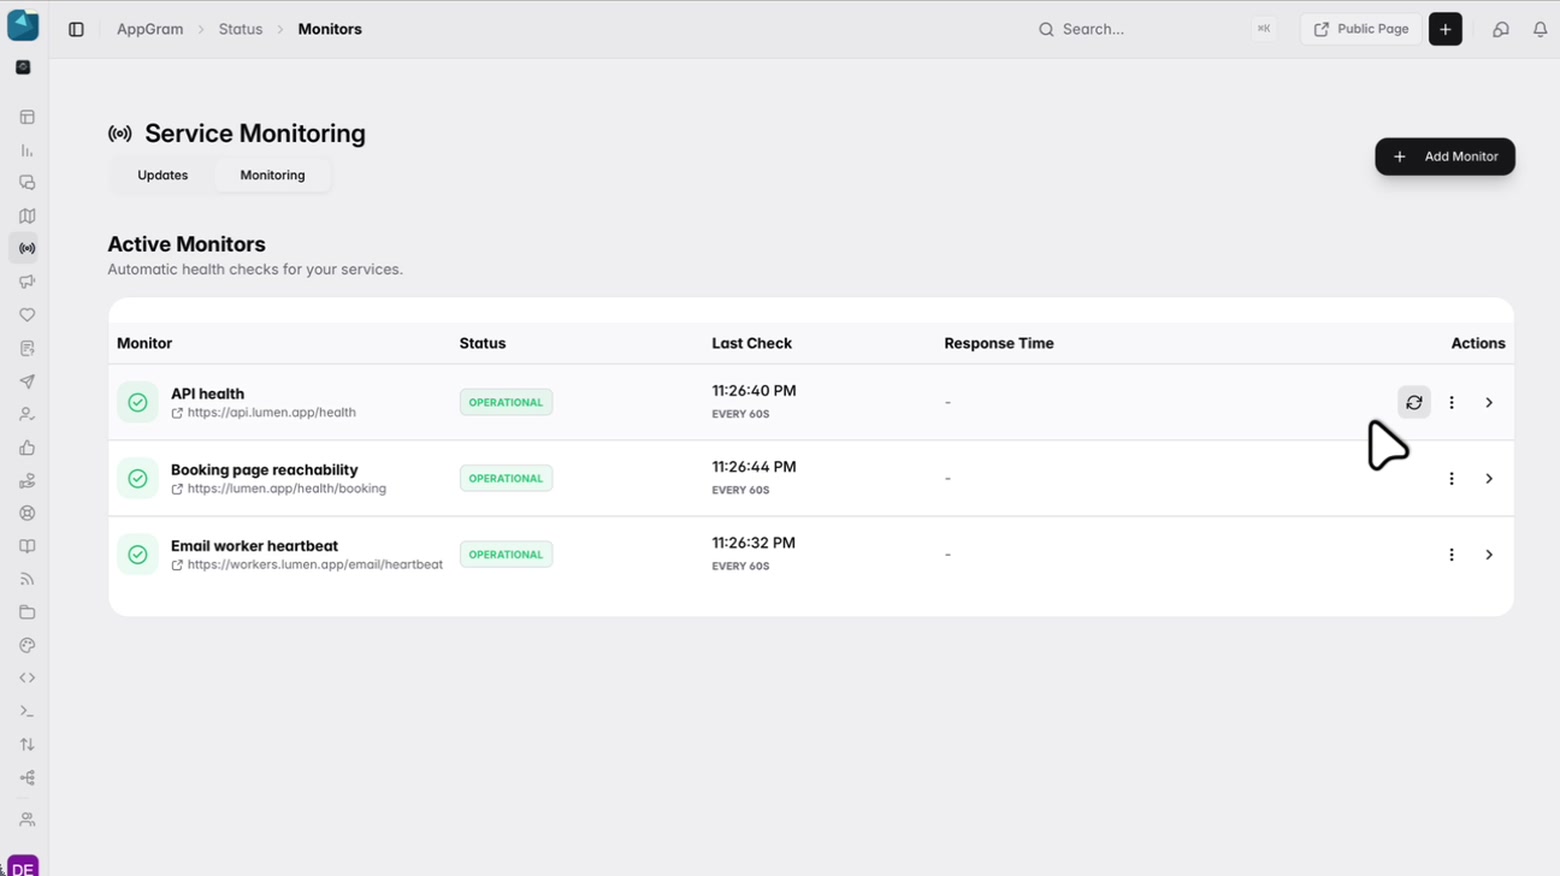
HTTP monitors check your endpoints on your interval, sixty seconds by default, and maintenance windows suppress them during planned work. Point Datadog, Pingdom, Better Stack, or your own health check at the inbound webhook and the incident opens with the right components already marked.
Configure
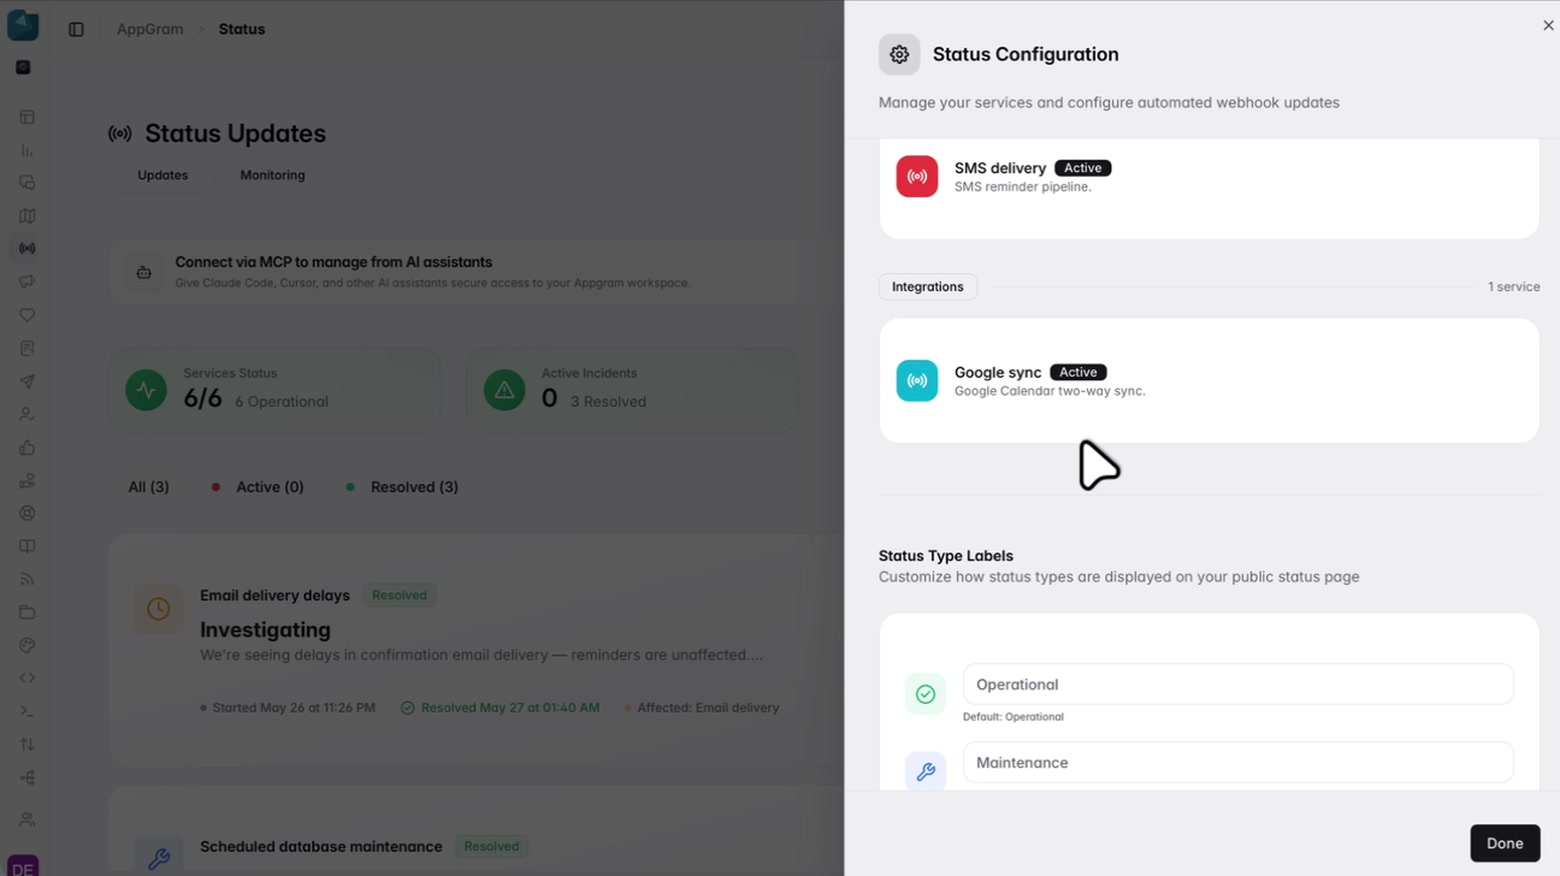
What appears on the page is a list you write, not a fixed set of slots. Name each service, describe it, group it however your customers think about your product, and give it a colour. Even the state labels are yours to rename.
Who uses it
For on-call engineers
Detection stays with Datadog or Better Stack. One webhook opens the incident here, marks the components, and fires the broadcast. No second console at 3am.
For support leads
Point customers at the page during an incident, and the public history stays up afterwards so "was it down last Tuesday" has an answer.
For enterprise sales
Real incidents with real timestamps on your own domain, and uptime available over the API when the security questionnaire asks for numbers.
Connected
Every module writes to the same customer graph, so data captured here shows up wherever it is useful — no connectors to authorize, no sync to babysit.
See all integrations →AppGram modules
FAQ
Yes. Point a CNAME at AppGram, verify it, and the page serves from your domain under your theme.
Yes. POST to the inbound webhook with your secret in the header and the incident opens with the components you name in the payload. Datadog, Pingdom, Better Stack, Grafana, or a curl from your own health check all work the same way.
Opening an incident fires an automation trigger and you route it — Slack, Discord, Teams, Telegram, or email through your own provider. The multichannel broadcast ships as an installable template. Notification is explicit rather than a built-in subscriber list, so the announcement lands where your customers already are.
No, and that is deliberate. A failing monitor fires an event; you decide whether that opens an incident, pages someone, or waits for a second consecutive failure. Auto-opening on one blip is usually wrong.
Yes — multiple pages per project, each with its own components. All of them are public; anything only your team should see belongs in the dashboard rather than on a status page.
Get started
Everything you were bolting together — feedback, roadmap, changelog, help, support, status, forms — in a single workspace with one API and one bill.
Cancel anytime. Yours to test on real customers.